
PerfView
Explore ETW logs and heap dumps intuitively
Description
PerfView simplifies the exploration of ETW logs and CLR heap dumps, providing a cohesive platform for performance analysis. It facilitates the collection of data from various sources and presents it in an organized manner, emphasizing CPU performance and memory usage. Key features include event filtering, call stack analysis, and memory graph visualization, empowering users to uncover root causes of slowdowns or crashes. Its straightforward design ensures that even complex diagnostics become manageable, saving time and effort in critical scenarios.
Screenshots
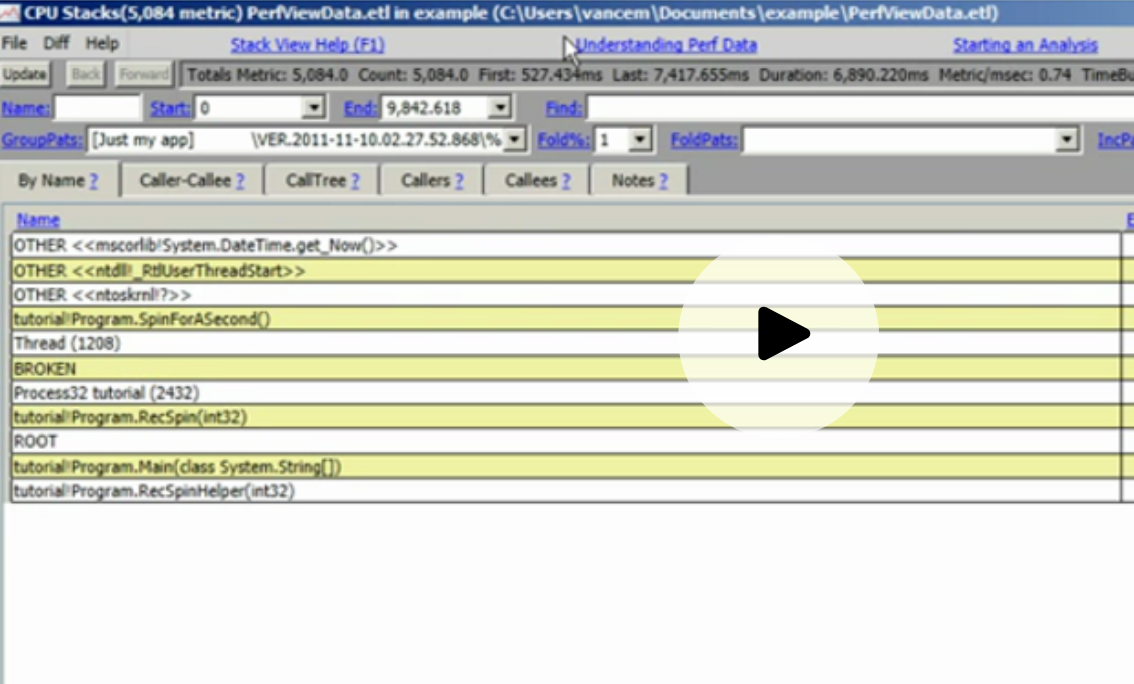
Click to view full size