

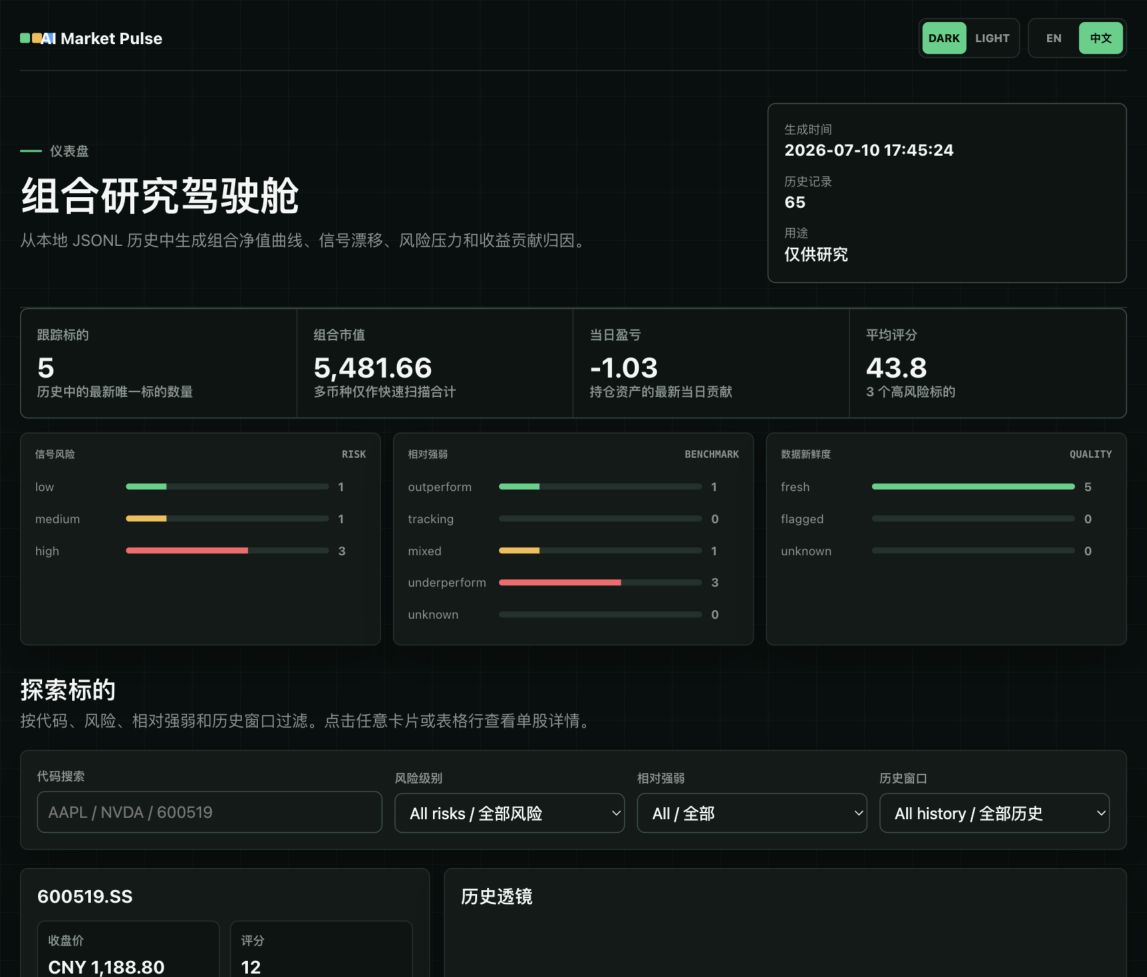
Hand the repetitive daily work of watching the market and organizing watchlist signals to a local script. Each day it compiles quotes, technical indicators, rule-based signals, relative strength, holding profit and loss, and an optional AI summary into a research report and dashboard. View them locally, or publish them as a static site.
To be clear up front: this is a research and reporting tool, not investment advice. It does not connect to brokers, does not place orders automatically, and does not promise any returns. All scores and signals are only organized historical data, for review and reference. Buy and sell decisions and the associated risks are your own responsibility.
What it solves
With a large watchlist, manually reviewing it before and after market open, recording signals, comparing strength against the market, and calculating holding profit and loss is both time-consuming and easy to miss things. This script fixes that process into a single command that produces a research report you can cross-check.
A complete workflow
Sign in to unlock this key section
New accounts get 10 free credits, plus 1 more for each daily check-in. Spend 1 credit to unlock and it stays open for you.
Try the 60-second demo first
It ships with offline sample data and needs no market data API, news API, or model key:
pip install -e ".[dev]"
market-pulse demo --output demo
After it finishes, open demo/site/index.html and demo/reports/dashboard.html to see the results. To run your own stock pool:
market-pulse run --symbols AAPL,MSFT,NVDA
It supports stocks, ETFs, and crypto assets, as well as Yahoo Finance compatible tickers. Recognizing holdings from screenshots, news, and AI summaries requires you to configure the corresponding keys yourself; viewing indicators and reports alone does not.
Who it is for
People who review their watchlist, do pre-market and post-market research, or check portfolio risk; people who want to turn "manually reviewing everything each day" into "one command produces the report", and who are willing to make their own judgments rather than expecting the tool to decide for them.
Notes
- To repeat: the tool only organizes data, gives no buy or sell advice, and promises no returns. A high score does not mean you should buy.
- Quotes and news come from third-party data sources and may be delayed or incomplete; verify important data yourself.
- If you configure a model for AI summaries, the summaries may also be wrong; treat them as reference, not conclusions.
Source and license
- Author repository: https://github.com/SilentFleetKK/ai-market-pulse (includes Chinese and English READMEs)
- License: MIT, implemented in Python.
Comments (0)
No comments yet. Start the conversation.